FII Datalyzer
Investment intelligence platform for tracking Foreign Institutional Investor holdings with automated data crawling.
Role
Full-Stack Developer
Duration
12 weeks
Industry
FinTech & Investment
Team Size
2 (Developer + Financial Analyst)
The Problem
An investment research firm needed a platform to aggregate and display Foreign Institutional Investor (FII) holding data from multiple regulatory sources. Previously, analysts spent 3-4 hours daily manually downloading and compiling data from PDF filings. The process was error-prone, slow, and limited the team's ability to identify trading patterns in real time. The platform needed to be private and access-controlled.
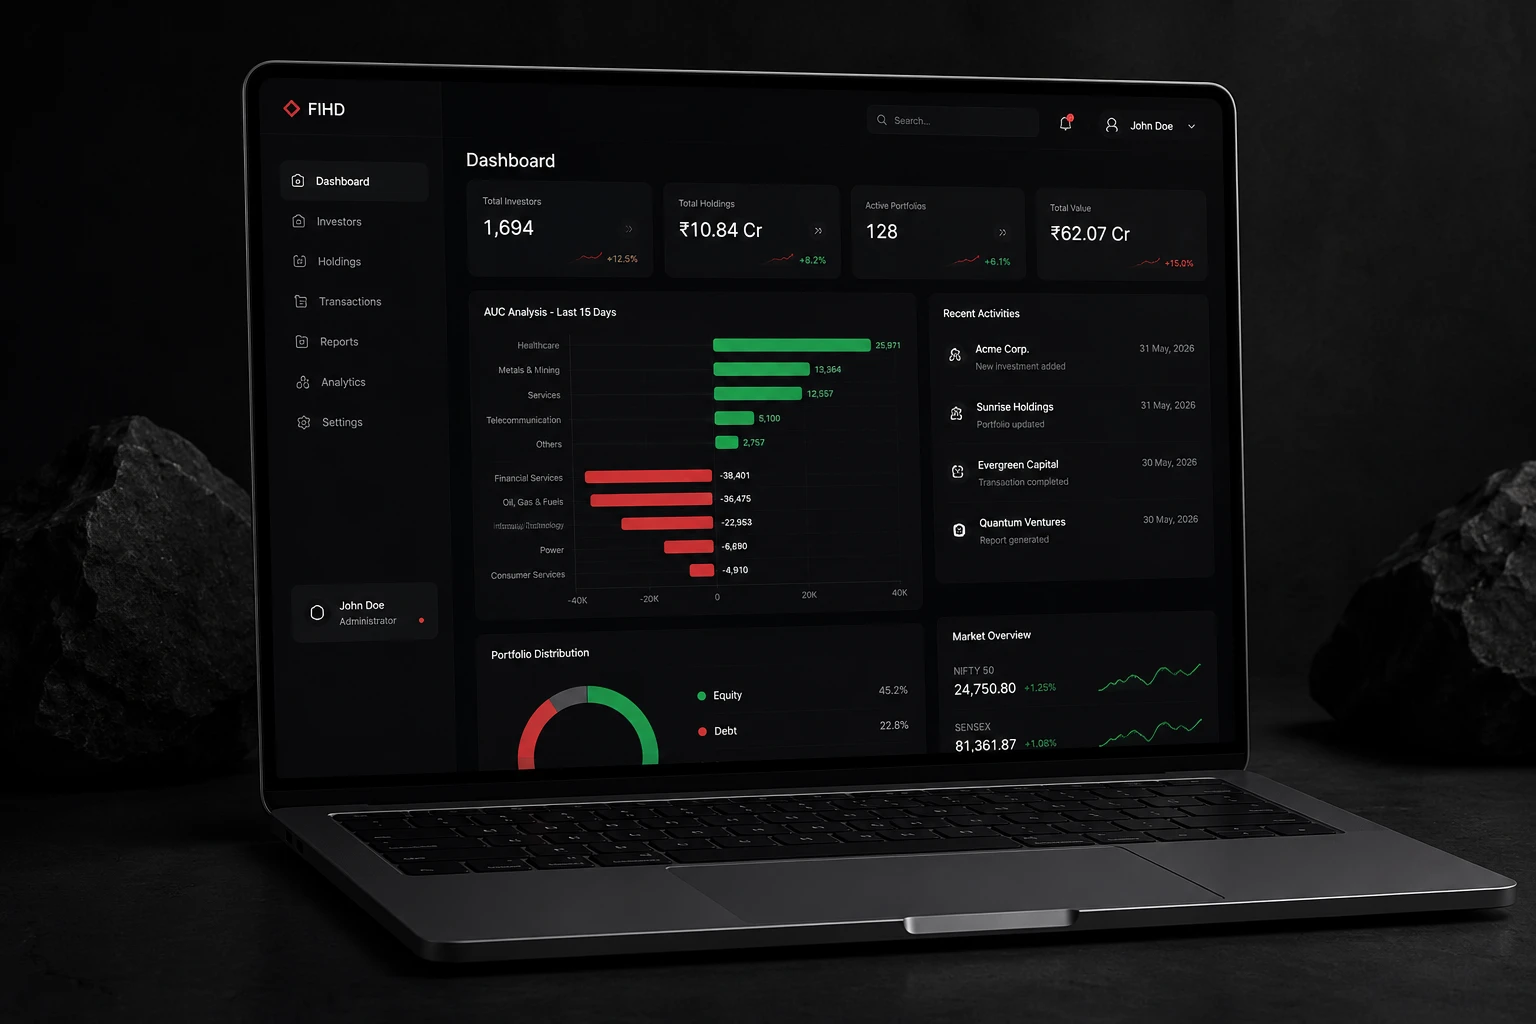
The Solution
I built a full-stack platform with a React frontend and Node.js backend. GitHub Actions run automated cron jobs every 15 minutes to crawl regulatory websites, parse filings, and update the database. The frontend displays interactive dashboards with real-time data filtering, trend analysis charts, and export capabilities. Custom data pipelines transform raw filings into structured, queryable data. The platform is access-controlled with private login.
Challenges
Web crawling regulatory sites required handling inconsistent data formats, CAPTCHAs, and rate limiting. I built a resilient crawler with exponential backoff, proxy rotation, and fallback data sources. The dashboard needed to render thousands of data points without performance degradation — solved with virtualised tables, debounced filtering, and Web Worker-based data processing.
Outcomes & Metrics
Performance Improvements
95th percentile API response time under 200ms despite querying thousands of records. Dashboard renders with virtual scrolling for datasets of any size. Database indexed for 10x query speed improvement on common filters. GitHub Actions workflow optimised to complete crawl-and-update cycle in under 3 minutes.
SEO Improvements
The platform is private and access-controlled, so public SEO was not a primary focus. Internal search functionality with faceted filtering was implemented for data discovery within the platform.
Accessibility Improvements
Financial charts include data table fallbacks for screen reader users. Colour palettes chosen for colour-blind accessibility with high contrast. Keyboard-navigable data tables with proper ARIA grid patterns. Focus management for dynamically updating content.
Business Outcome
Manual data collection effort reduced by 90%, saving 3-4 hours of analyst time daily. The platform processes 10,000+ data points per day from multiple sources. Real-time crawling enabled the firm to identify trading patterns ahead of competitors. The automated data pipeline became the firm's competitive advantage in research speed.
Lessons Learned
Web crawling in production requires robust error handling and monitoring — GitHub Actions provides good observability for scheduled jobs. Financial data visualisation needs to balance visual appeal with precision and accessibility. Automated data pipelines create immense business value by freeing skilled analysts from repetitive tasks.
Key Metrics at a Glance
Interested in a similar project?
Whether you need a corporate website, e-commerce platform, or custom web application — I would love to discuss your project.